In addition to earnings estimates, Proximilar’s AI models make a number of other powerful predictions. Today we will discuss our forecasts of the sizes (standard deviations) of stocks’ post-earnings moves. If you are an options trader or a risk manager, this data can be very valuable. To see how you can profit from it, let us look at our AI’s most recent forecasts of post-release move sizes. We will then compare them to move sizes implied by short-dated listed options. (Note that our move size forecast does not tell you the direction of the stock price change, but only its magnitude.)
When you get our spreadsheet (use the green button above) and open it, the largest companies with the most liquid stocks will be at the top. These stocks also tend to have the most active options markets. Column L (“Overnight move”) tells you how much volatility our AI expects immediately after the earnings release. There are hundreds of announcements this week, and as an example we will pick one that many investors focus on.
The Tesla example
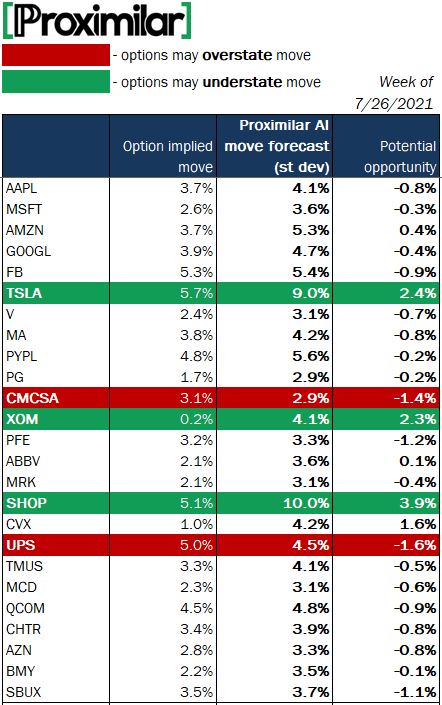
For Tesla (TSLA) the AI’s predicted move size is 9.0%. Is that a lot or a little? Well, by comparison to other stocks like Apple (AAPL; 4.1% move size forecast), it is a pretty big expected move. But Tesla is Tesla: it has posted large moves in recent years, some of them as big as 17%! The good way to assess the 9% up-or-down move forecast is to compare it to what TSLA option prices say. As of last Friday afternoon, the earnings move size implied by Tesla options was about 5.7%.
(For the purposes of this analysis, the option implied move is the earnings risk premium of a short-dated at-the-money straddle position. Online brokers have tools that will compute this risk premium for you. A straddle is a combination of a long put and a long call with the same expiration date and strike price.)
This makes for an interesting contrast: the options market thinks the stock will move less than 6% upon announcement, while our AI expects a move of about 9%. There are different ways to take advantage of this discrepancy. One approach is to enter a long near-the-money TSLA straddle position shortly before the earnings release. If the actual post-release move size is bigger than what the options market anticipates, this long straddle will be profitable.
Finding a pattern
The same logic can be applied to other stocks reporting earnings this week. We placed our AI’s move forecasts alongside option implied earnings moves and made a table. Here is a fragment of it:

As we examine the table above, our trade idea begins to take shape. If the option implied earnings move is a lot lower than the AI forecast, this may indicate that the implied volatility is too cheap, i.e., this is an options buying opportunity.
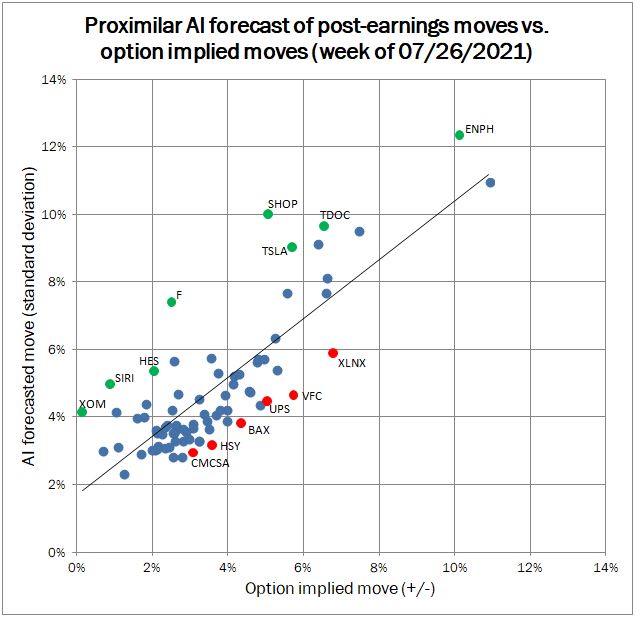
We can visualize opportunities by plotting the values from the table on a graph. That is when a clear pattern emerges. We can see that while the AI and the options market tend to agree on most stocks, they disagree about some of them. These disagreements are the points located far away from the regression line, and that is where the potential opportunity is at its greatest. We will mark the points of biggest disagreement in green and red:

Now, in addition to TSLA, we see a few other stocks where the earnings move may exceed the options market’s expectations. You can see them as the green dots on the graph above. They include Exxon Mobil (XOM), Ford (F), Hess (HES), Sirius XM (SIRI), Shopify (SHOP), Teladoc (TDOC) and Enphase Energy (ENPH).
At the same time, there are also stocks for which options appear to overstate the expected move. These correspond to the red dots below the regression line: Xilinx (XLNX), United Parcel Service (UPS), Comcast (CMCSA), Hershey (HSY), Baxter (BAX) and VF Corp (VFC). These may be good opportunities to sell overpriced short-term volatility.
Taking advantage of the opportunity
The strategy we outlined here requires familiarity with options markets and a healthy dose of common sense. Managing the risks of short-dated options is not easy. Sizing these trades correctly requires a good understanding of the risks involved. We certainly do not advocate trading earnings events if you are new to options trading.
But for seasoned investors who have the necessary experience our forecasts provide compelling opportunities. We update our forecasts every week enabling you to test this and other strategies for thousands of stocks every quarter.
No one can know exactly how big a particular earnings move will be. TSLA may move down by 2% or up by 20% after any single announcement date. The idea of this strategy is to find enough opportunities with sufficiently large “edge” to have your losing trades more than offset by winners most of the time.
Happy trading!