The Best Earnings Forecasts,
Made by AI
Get the most accurate EPS & revenue predictions in the world. Proximilar’s AI helps you uncover investment opportunities and manage earnings risk.
Free earnings forecasts for hundreds of companies reporting soon — all just a click away.
Make Earnings Surprises Less Surprising
27% Higher Accuracy,
70% Win Rate
Better than Wall St consensus at
predicting both EPS and sales
State-of-the-art AI
Revolutionary technology at your fingertips
No Bias
Analysts have conflicts of interest.
Our AI does not — it works for you
Risk Forecasts
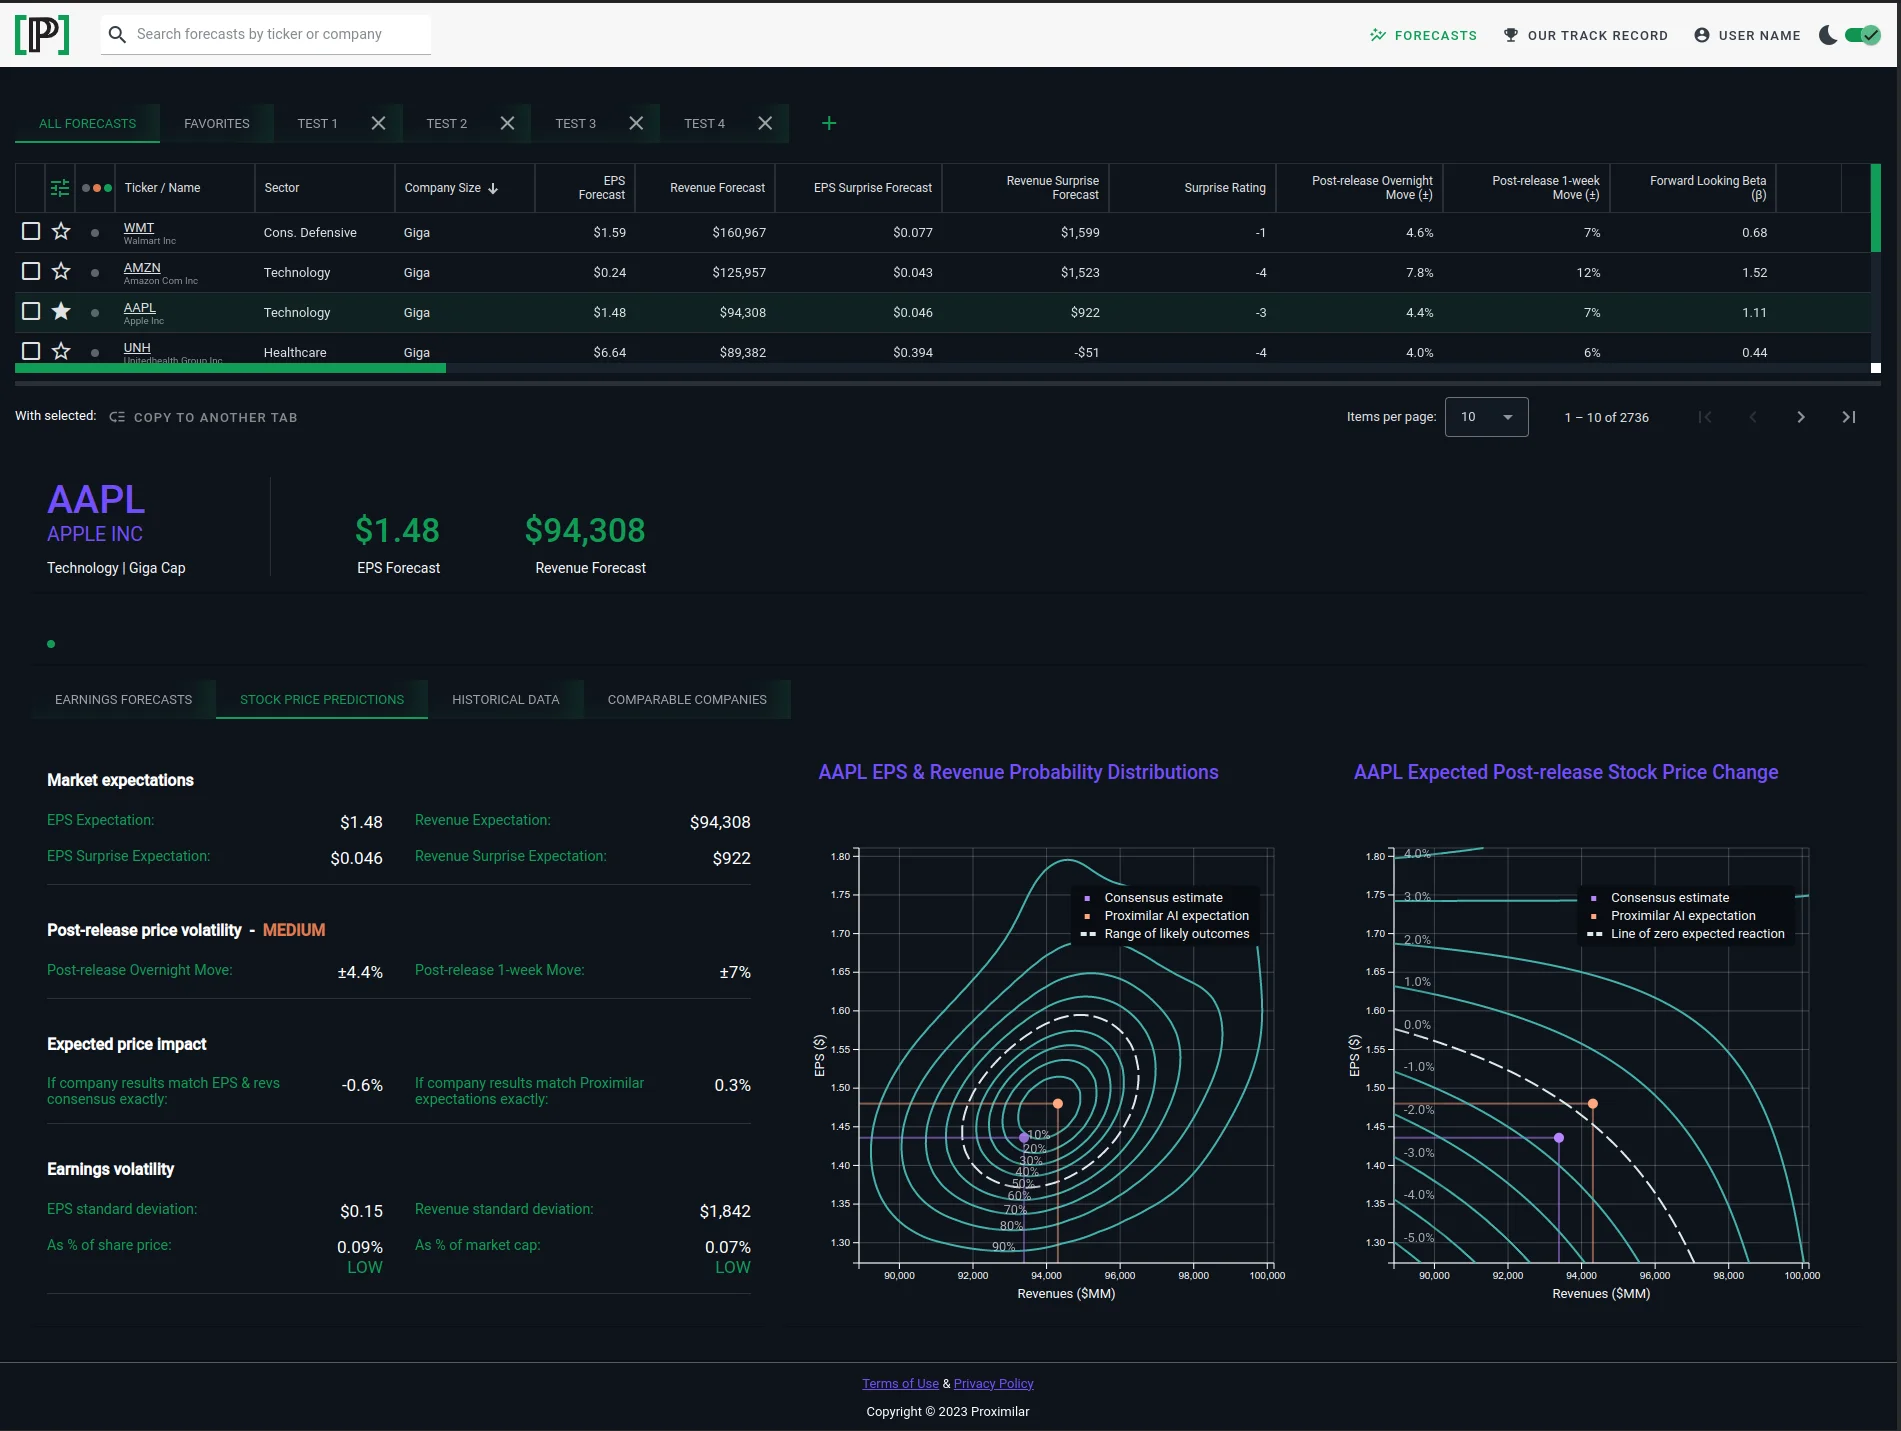
See how much earnings surprises can move your stocks up or down
Broadest Coverage Universe
Over 3000 US stocks, including companies analysts neglect
Built by Quants
Designed by finance pros with decades of experience in markets and modeling
Your Advantage With Proximilar
Our AI beats the competition in accuracy and makes the forecasts that traditional methods can’t make:
- Forecasts
- Proximilar AI
- Whisper Sites
- Crowdsourced Sites
- Earnings per Share (EPS)
- Revenues
- Surprise ratings How big & unusual the forecasted surprise opportunity is
- Price move size (up or down) Post-announcement volatility*
- EPS confidence intervals & probabilities
- Revenue confidence intervals & probabilities Probability distributions, standard deviations & odds of beating consensus
- Forward-looking beta (β) How much the stock is expected to move when the market moves 1%
- Bid-ask spread Estimated trading costs
* The share price move following earnings release may be positive or negative. This is a forecast of the expected magnitude of this move — whether up or down. Proximilar does not offer a forecast of the direction of the price change. It is impossible to forecast the direction of a stock with a high degree of certainty.
One Giant Leap
AI and data science are offering a quantum leap in financial forecasting. No matter their portfolio size, smart investors stand to benefit from it. For individual investors AI levels the playing field, putting within everyone’s reach the sophisticated research that only large hedge funds could afford until now. Large institutions gain the ability to analyze corporate fundamentals and price performance with unparalleled rigor and depth. The probabilistic tools we are building will go far beyond traditional scenario analysis.
Today we do this for earnings. Tomorrow we’ll do this for every aspect of a company‘s life cycle: fundamentals, credit risk, M&A, etc.
Join us, we’re just getting started!
We Make Earnings Surprises Less Surprising
Our Forecasts
We started building our forecasting models to support our own trading effort. Once we saw how useful they were in practice, we knew that other investors — both large and small — will benefit from them, too. That’s why we built this site.
Earnings per Share (EPS)
Expect Wall Street research analysts to be wrong
. This forecast gives you our AI’s best estimate of EPS and of analysts’ error, also known as the earnings surprise.
Revenues
Good estimates of company revenues (sales) are just as important as good EPS estimates
. Alas, the analyst consensus is not great at making them! Our AI does better.
Surprise ratings
These are actionable trading signals that tell you how uncommonly large each surprise we forecast is
. This way you can compare opportunities different stocks provide in an apples-to-apples fashion.
These ratings are on a scale from -5 to 5, where -5 means most unusually big downside surprise forecast, and 5 corresponds to most exceptional upside surprise forecasts.
Price move post-release (up or down)
Earnings releases are followed by the most volatile days of the quarter. They pack 10-15 days' worth of volatility — and often more —
into just one morning. You may not know in which direction the stock will move, but it will likely move by a lot. You should be ready for it and manage your positions accordingly.
EPS & Revenue confidence intervals
Any earnings prediction must be taken with a grain of salt.
Our confidence intervals show you how big that grain of salt is. With our probabilistic forecasts investors can quantify earnings volatility and risk like never before.
A single number cannot give you the whole picture. That is why we compute EPS standard deviations, probability distributions, odds of beating consensus and other probabilistic analytics for every US company.
Forward-looking beta (β)
The market beta is an important measure of how much a stock moves when the market (e.g., S&P 500) goes up or down
. For most stocks it is a positive number. The average beta of all stocks tends to be close to 1.
Most data providers estimate beta by looking at the last few months and assuming that the future will resemble the past. That approach is far too simplistic. Our model does not get fooled by a stock’s recent oscillations that are unlikely to repeat themselves. Its focus is on the stock’s future performance.
Expected bid-offer spread
This is how brokers make piles of money on your trades — despite charging you “zero commission”
: the spread between the asking price and the bid. Your trade can look good on paper, but disappoint in practice if you do not take the bid-offer spread into account.
This is another model we built to make our own trading more rigorous. For thousands of US stocks it estimates the transaction costs of a “roundtrip” trade, expressed both as a percentage of the share price and in cents per share. Trading spreads always fluctuate, and your actual costs will vary depending on time of day, market environment and other factors, but we find this estimate to be an excellent starting point.
Get in touch
An innovative product like ours naturally prompts a lot of questions.
That's great! We love to hear from you and help you learn.
